\(XX\) all-to-all Ising interactions
import itertools

import equinox as eqx
import jax
import jax.numpy as jnp
import seaborn as sns
import ultraplot as uplt
from rich.pretty import pprint

from squint.circuit import Circuit
from squint.ops.base import SharedGate, Wire
from squint.ops.dv import DiscreteVariableState, HGate, RXXGate, RZGate
from squint.simulator.tn import Simulator
from squint.utils import partition_op
from squint.visualize import draw
dim = 2
n = 4
wires = [Wire(dim=dim, idx=i) for i in range(n)]
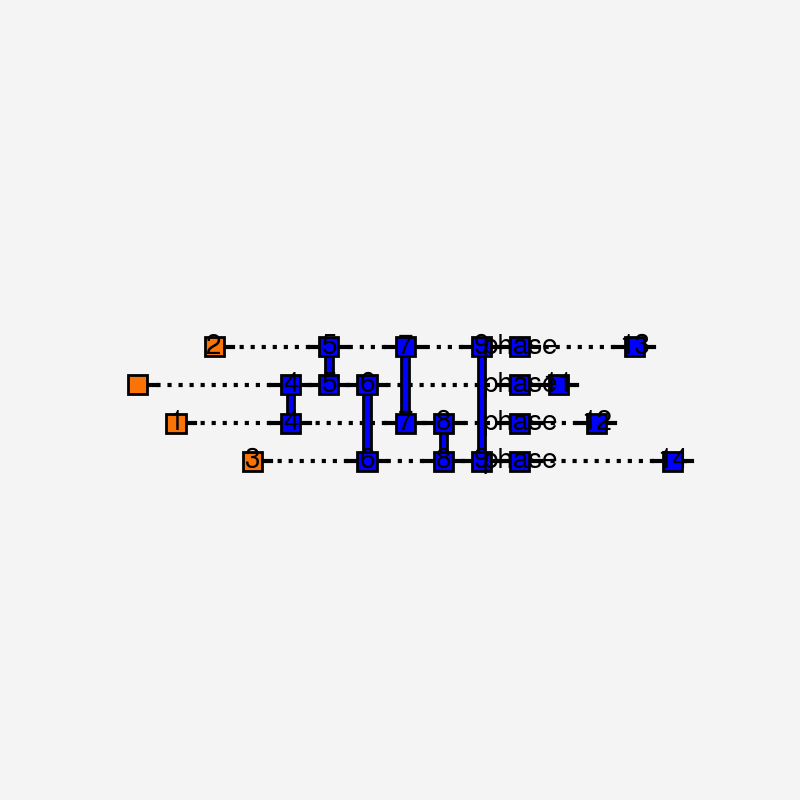
circuit = Circuit()
for w in wires:
circuit.add(DiscreteVariableState(wires=(w,), n=(0,)))
for i, j in itertools.combinations(list(range(n)), 2):
circuit.add(RXXGate(wires=(wires[i], wires[j]), angle=jnp.pi / 4))
circuit.add(
SharedGate(op=RZGate(wires=(wires[0],), phi=0.1 * jnp.pi), wires=tuple(wires[1:])),
"phase",
)
for w in wires:
circuit.add(HGate(wires=(w,)))
pprint(circuit)
params, static = partition_op(circuit, "phase")
sim = Simulator.compile(static, params, optimize="greedy").jit()
prob = sim.probabilities.forward(params)
dprob = sim.probabilities.grad(params)
cfi = sim.probabilities.cfim(params).squeeze()

print(f"CFI is {cfi}")
[(1.0, (0,))]
[(1.0, (0,))]
[(1.0, (0,))]
[(1.0, (0,))]
[(1.0, (0,))]
[(1.0, (0,))]
[(1.0, (0,))]
[(1.0, (0,))]
[(1.0, (0,))]
[(1.0, (0,))]
[(1.0, (0,))]
[(1.0, (0,))]
[(1.0, (0,))]
[(1.0, (0,))]
[(1.0, (0,))]
[(1.0, (0,))]
CFI is 15.999999999948939
phis = jnp.linspace(-jnp.pi, jnp.pi, 100)
params = eqx.tree_at(lambda pytree: pytree.ops["phase"].op.phi, params, phis)

probs = jax.vmap(sim.probabilities.forward)(params)
grads = jax.vmap(sim.probabilities.grad)(params).ops["phase"].op.phi
qfims = jax.vmap(sim.amplitudes.qfim)(params)
cfims = jax.vmap(sim.probabilities.cfim)(params)
[(1.0, (0,))]
[(1.0, (0,))]
[(1.0, (0,))]
[(1.0, (0,))]
[(1.0, (0,))]
[(1.0, (0,))]
[(1.0, (0,))]
[(1.0, (0,))]
[(1.0, (0,))]
[(1.0, (0,))]
[(1.0, (0,))]
[(1.0, (0,))]
[(1.0, (0,))]
[(1.0, (0,))]
[(1.0, (0,))]
[(1.0, (0,))]
[(1.0, (0,))]
[(1.0, (0,))]
[(1.0, (0,))]
[(1.0, (0,))]
[(1.0, (0,))]
[(1.0, (0,))]
[(1.0, (0,))]
[(1.0, (0,))]
colors = sns.color_palette("Set2", n_colors=jnp.prod(jnp.array(probs.shape[1:])))
fig, axs = uplt.subplots(nrows=3, figsize=(6, 4), sharey=False)
for i, idx in enumerate(
itertools.product(*[list(range(ell)) for ell in probs.shape[1:]])
):
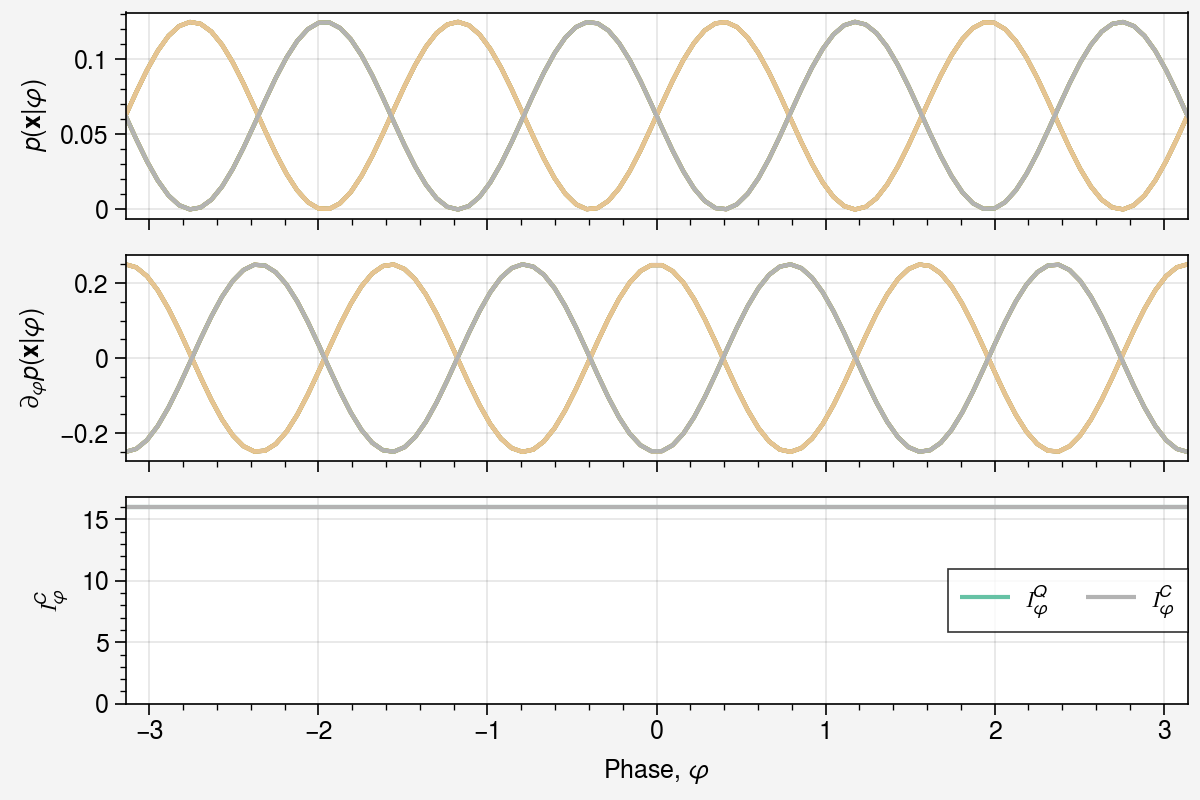
axs[0].plot(phis, probs[:, *idx], label=f"{idx}", color=colors[i])
axs[1].plot(phis, grads[:, *idx], label=f"{idx}", color=colors[i])
axs[0].set(ylabel=r"$p(\mathbf{x} | \varphi)$")
axs[1].set(ylabel=r"$\partial_{\varphi} p(\mathbf{x} | \varphi)$")
axs[2].plot(phis, qfims.squeeze(), color=colors[0], label=r"$\mathcal{I}_\varphi^Q$")
axs[2].plot(phis, cfims.squeeze(), color=colors[-1], label=r"$\mathcal{I}_\varphi^C$")
axs[2].set(
xlabel=r"Phase, $\varphi$",
ylabel=r"$\mathcal{I}_\varphi^C$",
ylim=[0, 1.05 * jnp.max(qfims)],
)
axs[2].legend();