Single qubit: phase estimation
This example shows a one-qubit interference experiment.
import itertools

import equinox as eqx
import jax
import jax.numpy as jnp
import seaborn as sns
import ultraplot as uplt
from rich.pretty import pprint

from squint.circuit import Circuit
from squint.ops.base import Wire
from squint.ops.dv import DiscreteVariableState, HGate, RZGate
from squint.simulator.tn import Simulator
from squint.utils import partition_op
wire = Wire(dim=2, idx=0)

circuit = Circuit()

#          ____      ___________      ____
# |0> --- | H | --- | Rz(\phi) | --- | H | ----
#         ----      -----------      ----

circuit.add(DiscreteVariableState(wires=(wire,), n=(0,)))
circuit.add(HGate(wires=(wire,)))
circuit.add(RZGate(wires=(wire,), phi=0.0 * jnp.pi), "phase")
circuit.add(HGate(wires=(wire,)))

pprint(circuit)
params, static = partition_op(circuit, "phase")
sim = Simulator.compile(static, params, optimize="greedy")
ket = sim.amplitudes.forward(params)
dket = sim.amplitudes.grad(params)
prob = sim.probabilities.forward(params)
dprob = sim.probabilities.grad(params)

print(f"Shape of ket is: {ket.shape}, with dtype {ket.dtype}")
print(f"Shape of prob is: {prob.shape}, with dtype {prob.dtype}")
phis = jnp.linspace(-jnp.pi, jnp.pi, 100)
params = eqx.tree_at(lambda pytree: pytree.ops["phase"].phi, params, phis)

probs = jax.vmap(sim.probabilities.forward)(params)
qfims = jax.vmap(sim.amplitudes.qfim)(params)
cfims = jax.vmap(sim.probabilities.cfim)(params)
colors = sns.color_palette("Set2", n_colors=jnp.prod(jnp.array(probs.shape[1:])))
fig, axs = uplt.subplots(nrows=2, figsize=(6, 4), sharey=False)
for i, idx in enumerate(
itertools.product(*[list(range(ell)) for ell in probs.shape[1:]])
):
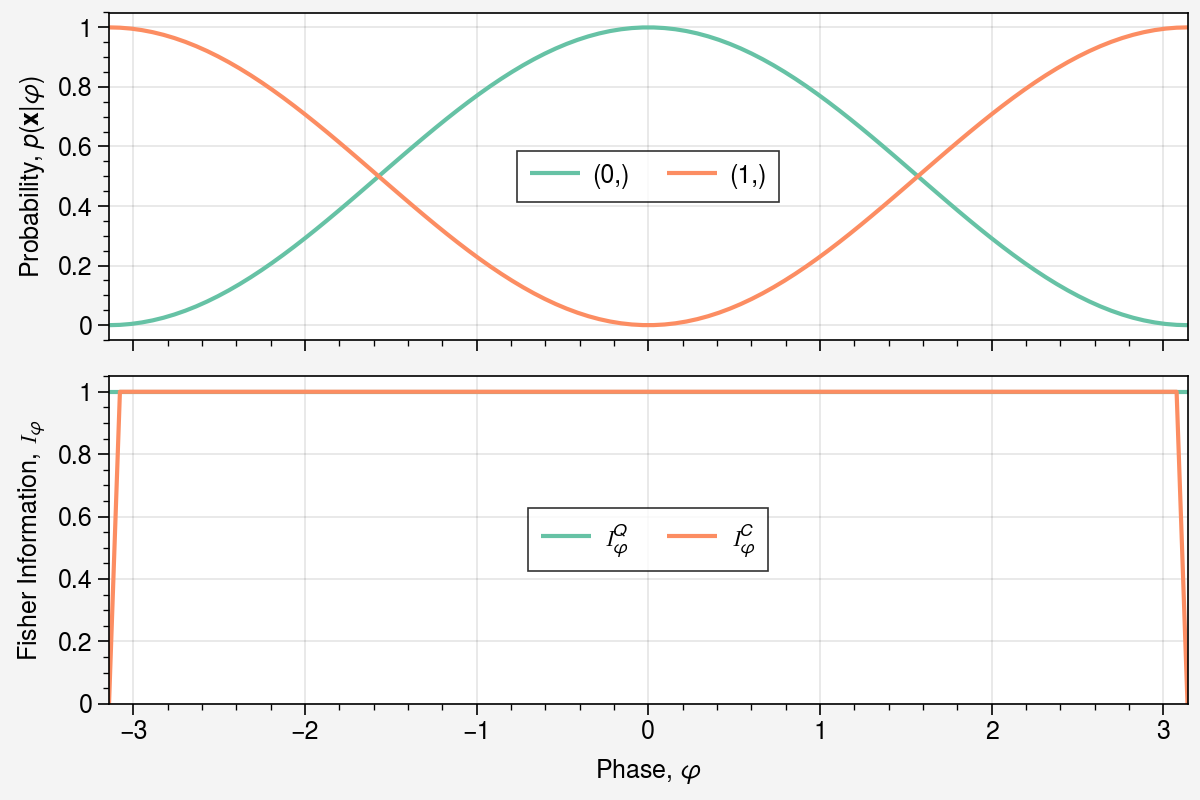
axs[0].plot(phis, probs[:, *idx], label=f"{idx}", color=colors[i])
axs[0].legend()
axs[0].set(xlabel=r"Phase, $\varphi$", ylabel=r"Probability, $p(\mathbf{x} | \varphi)$")
axs[1].plot(phis, qfims.squeeze(), color=colors[0], label=r"$\mathcal{I}_\varphi^Q$")
axs[1].plot(phis, cfims.squeeze(), color=colors[-1], label=r"$\mathcal{I}_\varphi^C$")
axs[1].set(
xlabel=r"Phase, $\varphi$",
ylabel=r"Fisher Information, $\mathcal{I}_\varphi$",
ylim=[0, 1.05 * jnp.max(qfims)],
)
axs[1].legend();